
What’s Happening in the Derbyshire Property Market?
Our July Derbyshire Property Market Report was really well received, so we're back with the August update. Using our three-layer model, we combine official house price data, actual Land Registry sales and current buyer activity to give a clear picture of what's really happening across Derby, Alfreton and wider Derbyshire. See what it means for you.
What the latest data means for sellers, buyers and landlords in Derby, Alfreton and across Derbyshire
Published: 24 August 2026
What is actually happening in the Derbyshire property market?
The latest figures give us an interesting picture. Official completed-sale data remains positive across much of Derbyshire, but the more immediate indicators suggest buyers have become more cautious over the summer. That might sound contradictory, but it is exactly why we do not rely on one set of property statistics.
At Cope & Co., we use our three-layer market model to understand not only what the numbers say, but what they could mean for people thinking of selling, buying or investing.

How our three-layer market model works
Property market reports often appear to disagree with one another because they are measuring different stages of a property sale. Our approach combines three different perspectives.
Layer one: confirmed property price trends
We start with the official UK House Price Index, produced using completed and registered property transactions. This tells us where property values have been moving rather than simply looking at what sellers are asking.
The latest release covers June 2026 and was published on 19 August 2026.
Layer two: what buyers have actually paid
We then look at actual completed-sale evidence from HM Land Registry Price Paid Data. That allows us to get closer to the local market and compare the prices paid for different types of property.
HM Land Registry's latest Price Paid Data currently includes June 2026 transactions, although the Land Registry specifically warns that the newest month is incomplete because additional transactions will be added as registrations arrive. For that reason, we look at longer periods rather than treating one month's registrations as a complete picture.
Layer three: what is happening right now
Finally, we look at current market activity. That includes asking prices, the amount of property available, how long homes are taking to find buyers and the number of sales being agreed.
These indicators are less useful for telling us what a property has actually sold for, but they can give us an earlier indication of where the market may be heading.
The important bit is putting all three layers together.
A market can have rising completed prices at exactly the same time as asking prices are falling and buyers are becoming more selective. That is broadly what we are seeing now.

Layer one: completed prices remain positive across Derbyshire
For our first layer, we look at completed property sales rather than asking prices. As with our July report, we use the MEDIAN sale price rather than a simple average.
The median is the middle price when all completed sales are placed in order. We prefer this for our local reporting because it is less likely to be distorted by a small number of particularly expensive, or unusually cheap, transactions.
For consistency, the table below uses the latest stable full-year HM Land Registry completed-sale figures for 2025, alongside the latest UK House Price Index annual trend for June 2026.
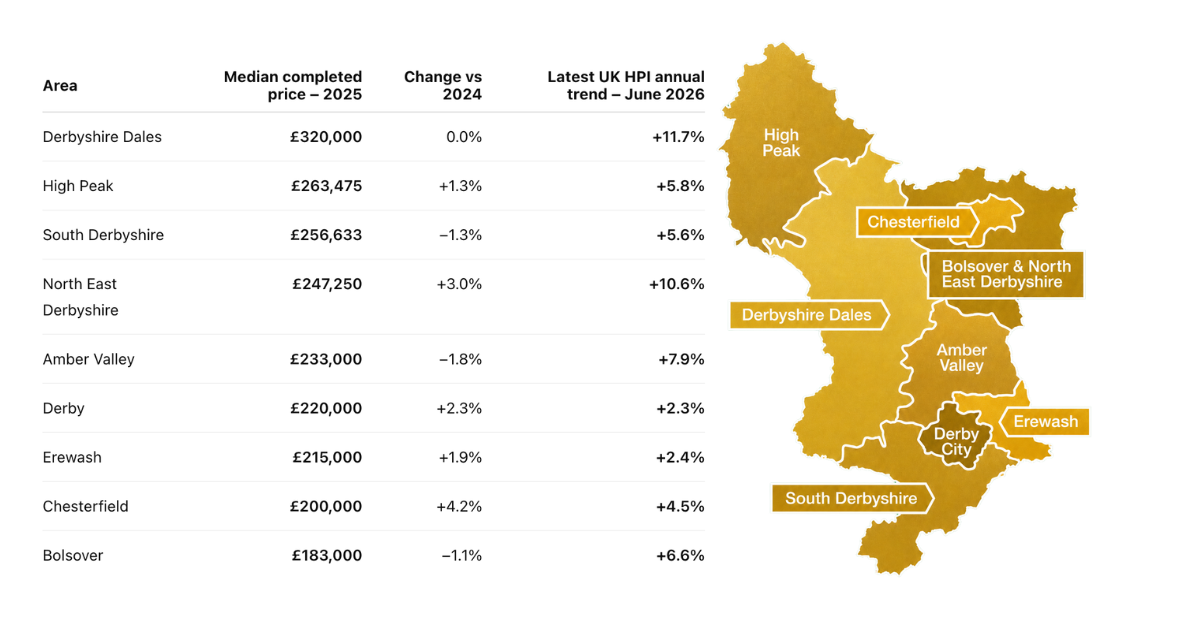
Sources: HM Land Registry Price Paid Data and UK House Price Index.
The median figures are calculated from standard completed-sale transactions, while the UK HPI percentages are the latest mix-adjusted annual price trends for June 2026. HM Land Registry advises against using the newest Price Paid Data month in isolation because further registrations continue to be added.
So, what does that tell us?
There is an important distinction here. The 2025 median figures show what a typical buyer actually paid, while the latest UK HPI figures give us an indication of how comparable property values have moved since then.
For example, the median completed price in Amber Valley was £233,000 during 2025. That gives homeowners in Alfreton a much more useful benchmark than an average that could be pulled upwards by a relatively small number of expensive sales. At the same time, the latest UK HPI shows Amber Valley values running 7.9% above June 2025. That suggests the wider market has strengthened since many of the transactions included in the 2025 median were completed.
In Derby, the 2025 median completed price was £220,000, with the latest UK HPI showing more modest annual growth of 2.3%. So Derby appears to be experiencing a steadier market than some of the surrounding Derbyshire districts.
The strongest current HPI movements are in Derbyshire Dales, up 11.7%, and North East Derbyshire, up 10.6%. However, we would not interpret those percentages as meaning every property in those areas has risen by the same amount.
We don't use June's raw median on its own. HM Land Registry's June 2026 Price Paid Data is already available, but it is not yet a complete record of everything that sold during June.
Further transactions will continue to be registered and added in later releases. HM Land Registry specifically recommends that the latest month should not be used in isolation as an indication of market activity. That is why we prefer a stable median period for the price benchmark and use the newer UK HPI alongside it to understand the direction in which values are moving.
Put simply, the median tells us what buyers have actually been paying. The HPI helps tell us which way comparable property values are moving. Using the two together gives us a much more useful picture than relying on either figure alone.

Layer two: what buyers are actually paying
HM Land Registry Price Paid Data is useful because it records actual transactions rather than asking prices. To put the local market into context, current sold-price data sourced from Land Registry records shows an average sold price over the past 12 months of approximately:
- £261,077 across Derbyshire
- £234,013 in Derby
- £207,317 in Alfreton
The type of home makes a considerable difference.
Average sold prices over the past 12 months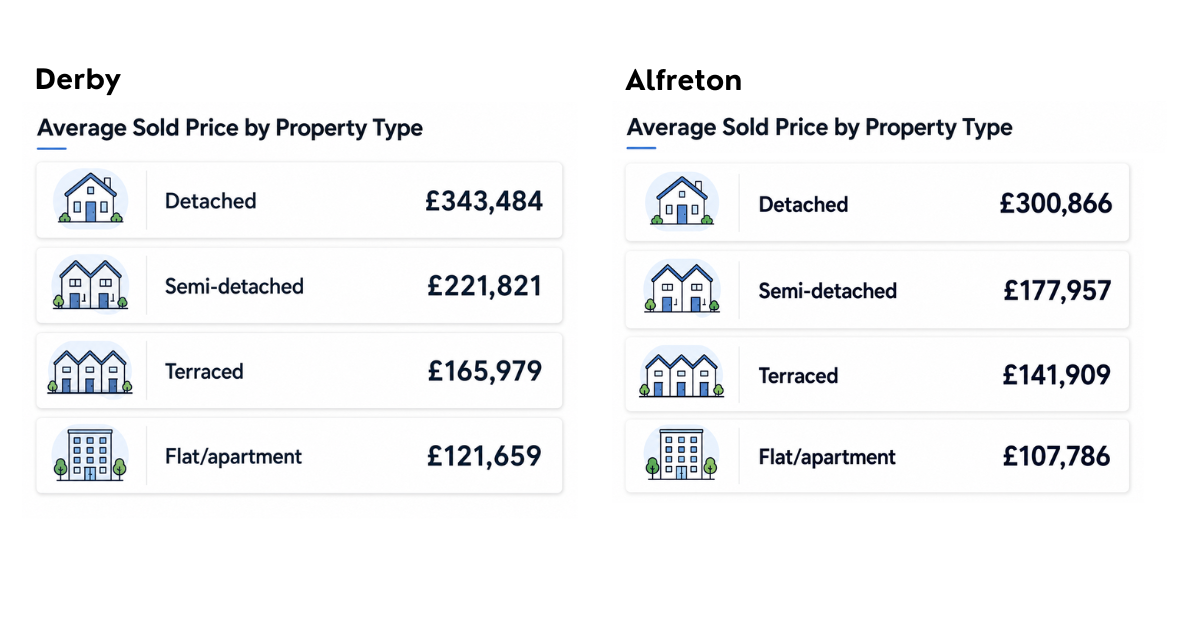
For the wider DE55 postcode area, which covers Alfreton and a number of surrounding communities, the average sold price over the past 12 months is approximately £205,586. These numbers demonstrate why local interpretation matters.
If you own a three-bedroom semi-detached home in Alfreton, the Derbyshire-wide average of £261,077 is not especially useful when deciding how to price your property.
What matters much more is:
🔹 What similar homes nearby have actually sold for.
🔹 How recently they sold.
🔹 Whether they were genuinely comparable.
🔹 Their condition and presentation.
🔹 Whether they had extensions, parking or larger gardens.
🔹 What competing properties are available today.
That is the difference between market data and a property valuation. One provides context. The other requires local judgement.

Layer three: the current market is softer
This is where the August figures become particularly important. Rightmove's latest House Price Index shows the average asking price of a newly listed property in the East Midlands at approximately £288,536.
That is:
🔹 1.0% lower than July
🔹 1.0% lower than August 2025
🔹 with an average of 67 days to find a buyer.
So, while official completed prices in Derbyshire are higher than a year ago, today's sellers are coming to market at slightly lower asking prices. That tells us something important.
Buyers currently have more leverage
Zoopla's latest market report provides another useful signal.
Across the UK, sales agreed were 9% lower than a year earlier, while in the East Midlands they were down approximately 13%. Zoopla also reports that around 30% of homes listed since the second quarter were still unsold without having reduced their asking price. This does not suggest buyers have disappeared, it suggests buyers have become more selective.
When there is plenty of choice, they are less likely to chase a property that looks expensive compared with the alternatives, and that changes the strategy for sellers.

So, is the Derbyshire market going up or slowing down?
Both!
This is the key reason we use three layers.
The official UK HPI is telling us: Property values have risen over the past year.
Land Registry sold-price evidence is telling us: Buyers are still completing transactions at healthy values, but individual property types and locations vary enormously.
Rightmove and Zoopla are telling us: Today's market is more competitive, with greater choice for buyers, fewer sales being agreed and more pressure on asking prices.
Put those three observations together and our interpretation is:
Derbyshire is not experiencing a widespread price collapse, however, the market has shifted in the buyer's favour compared with some of the faster-moving periods of recent years.

What does this mean if you're selling?
For sellers, the biggest message from the August data is simple:
Getting the price right from day one matters more than ever
The danger at the moment is looking at the latest annual house-price growth figure and assuming that means you can automatically add another 5%, 8% or 10% to your asking price.
The current market data does not support that approach.
Buyers have choice. If your property appears noticeably more expensive than similar homes, many will simply move on to the next listing.
Don't confuse value with asking price
There is an important difference between: “My home has increased in value over the past year.” and “I can ask whatever price I want because the market is rising.”
The first may well be true. The second is much harder to justify in the current market.
The first few weeks are important
A new listing receives its greatest burst of attention when it first appears online. If the price is wrong during that period, you can waste your strongest opportunity to attract serious buyers.
Reducing the price several months later may eventually generate enquiries, but by then buyers may already be wondering why the property has not sold.
Derby and Alfreton sellers need genuinely local evidence
For a property in Derby, that might mean comparing recent sales within a handful of surrounding streets rather than looking at the city's £204,016 HPI average.
For an Alfreton property, it means going deeper than Amber Valley's 7.9% annual growth figure and examining genuinely comparable DE55 sales.
In today's market, good pricing is not about being cheap. It is about giving buyers a reason to act.

What does this mean if you're buying?
There is definitely good news for buyers. You generally have more choice and potentially more negotiating power than you did when properties were attracting multiple offers almost immediately. That does not mean every seller is desperate to negotiate!
The best homes, particularly those that are well presented, well located and sensibly priced, can still attract plenty of interest. But where a property:
🔹 Has been available for several months.
🔹 Has already been reduced.
🔹 Requires substantial work.
🔹 Has obvious competing listings nearby.
🔹 Was ambitiously priced from the start.
...there may be more room for a sensible conversation about price.
Use sold prices, not just asking prices
A property advertised at £300,000 is not evidence that it is worth £300,000. Look at what similar homes have actually sold for.
That is particularly useful in areas such as Derby and Alfreton, where relatively small geographical differences can have a significant impact on achievable price.
Buyers should also consider mortgage costs carefully.
Zoopla reports that higher borrowing costs have contributed to the summer slowdown, which means affordability, not simply the headline purchase price, continues to influence buyer behaviour.

What does this mean for landlords?
The rental market continues to deserve separate consideration from the sales market. The most recently published detailed local ONS figures show average monthly rents of approximately £855 in Derby and £793 in Amber Valley, with annual increases of 1.8% and 3.2% respectively. Those are averages across all property types.
For example, the same ONS data shows average Derby rents ranging from around £604 for a one-bedroom property to £1,294 for homes with four or more bedrooms.
In Amber Valley, the corresponding averages were approximately £579 for one bedroom and £1,270 for four or more bedrooms.
Don't buy an investment based on headline rent alone
For landlords, the key question is not: “Which area has the fastest rent growth?” It is “Does this particular property stack up as an investment?” That means looking at:
🔹 Achievable rent.
🔹 Purchase price.
🔹 Mortgage costs.
🔹 Gross and net yield.
🔹 Maintenance.
🔹 Energy efficiency.
🔹 Compliance costs.
🔹 Expected void periods.
🔹 Tenant demand.
🔹 Potential capital growth.
A property with a £1,000 monthly rent is not automatically a better investment than one achieving £800. If it costs considerably more to purchase and maintain, the lower-rent property could produce the stronger return. This is another area where Derby and Alfreton can offer very different opportunities depending on the property type and target tenant.

Our outlook for the Derbyshire property market
The latest data points towards a stable but increasingly price-sensitive market. Completed prices remain encouraging.
Derbyshire's official HPI figure is 6.6% higher than a year ago, while Amber Valley is up 7.9%, North East Derbyshire 10.6% and Derbyshire Dales 11.7%.
But we would be cautious about assuming those rates will simply continue.
The forward-looking indicators are softer. East Midlands asking prices are now 1% below last August, and Zoopla reports sales agreed in the region around 13% lower than a year ago. That suggests the next phase of the market may be less about rapidly rising prices and more about the difference between correctly priced and incorrectly priced properties.
For sellers, realistic pricing and strong presentation will be crucial.
For buyers, greater choice creates opportunities, but well-priced homes will still command interest.
For landlords, rental demand remains important, but purchase price, financing and operating costs need to be considered alongside rent.

Thinking of selling, buying or investing in Derby or Alfreton?
Property market statistics are useful, but they are most valuable when somebody interprets them in the context of your actual property and your circumstances.
A Derbyshire-wide average cannot tell you the value of a particular house in Derby.
Amber Valley's annual growth figure cannot tell you exactly what a three-bedroom home in Alfreton will achieve.
And an online asking price cannot tell you what a serious buyer will ultimately be prepared to pay.
That is why our approach at Cope & Co. is to combine official market data, actual completed sales and current buyer behaviour.
We do not just present the numbers, we use them to help you understand what the market could mean for your next move.

Data reviewed on 24 August 2026. UK HPI figures relate to June 2026 and remain provisional. HM Land Registry's latest Price Paid Data release includes June 2026 transactions but remains incomplete for recent months because of registration delays. Rightmove figures relate to August 2026 asking prices. Zoopla market-activity figures were published on 30 July 2026. Local ONS rental figures quoted are the latest detailed figures verified for June 2026. Contains HM Land Registry data © Crown copyright and database right 2021. This data is licensed under the Open Government Licence v3.0.